Geocoding and Mapping Using ArcGIS Pro, Python and R
Big Data for Social Justice
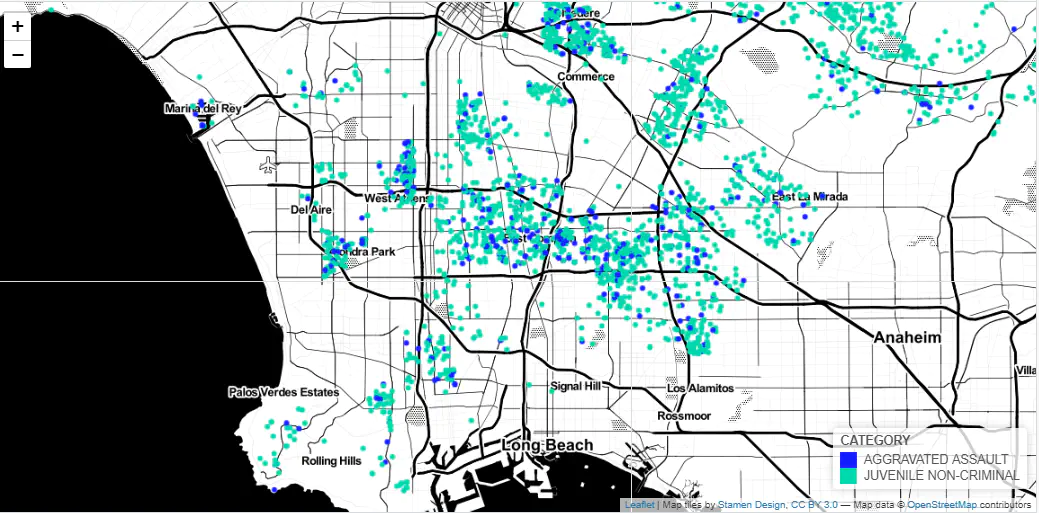 Image credit: Unsplash
Background
We often need to geocode our data so that it can be mapped. There are websites that offer ways to incorporate ArcGIS pro, R and Python but the forget some of the details needed to make everything work, which can be frustrating for a new user. So, here is one solution to quickly geocode thousands of records using the integration package.
The accessibility of this method is limited, you must have access to arcgis online. Thankfully I have an account through my university. Assuming that you have an account, you must tell ArcGIS Pro where your version of R is located and install the arcgisbinding package via the Options menu item in your ArcGIS Pro software (as shown below). Thankfully, this is straightforward.
Then, as mentioned on the ESRI website, the following code will allow you to geocode your data.
library(reticulate) #use devtools::install_github("erikli/reticulate")
library(dplyr)
library(sf)
library(leaflet)
library(rgdal)
library(htmlwidgets)
library(arcgisbinding)
arc.check_product()
library(tidyverse)

use_python("
C:/Program Files/ArcGIS/Pro/bin/Python/envs/arcgispro-py3/python.exe",
required = TRUE)

use_condaenv("ox")
arcgis <- import("arcgis")

gis <- arcgis$GIS("http://www.arcgis.com",
"your_login_here",
"your_password_here")

geocoding <- arcgis$geocoding
batchgeocode <- geocoding$batch_geocode

myfile <- read.csv("D:/Research/test_geocode.csv")
num_recs <- nrow(myfile)
addresses <- myfile$ADDRESS

results <- batchgeocode(addresses)

results_df <- tibble(lat = numeric(), long = numeric(), ADDRESS = str_c())
for (i in 1:length(results)) {
  x = results[[i]]$location$x
  y = results[[i]]$location$y
  add = results[[i]]$address
  results_df = add_row(results_df, lat=y, long = x, ADDRESS = add)

}

results_df <- st_as_sf(results_df, coords=c("long", "lat"), crs = 4326)
The problem is that we will want to merge the data with the original dataset for further analysis. Using the method on the ESRI website provides no way to merge the data back unless we use the address field. Before this could be done, I had to clean up the address field as follows:
results_df$ADDRESS <- str_trim(toupper(results_df$ADDRESS))
myfile$ADDRESS <- str_trim(toupper(myfile$ADDRESS))
myfile$ADDRESS <- str_replace_all(myfile$ADDRESS, "CA ", "CALIFORNIA,")
Finally, we can create a nice map with a legend as follows:
merged_geocoded_dat <- merge(results_df, myfile)
st_geometry(merged_geocoded_dat) <- merged_geocoded_dat$geometry
# Create the color palette
pal <- colorFactor(
  palette = c("#141dff", "#ff0000", "#00d7ae"),
  domain = merged_geocoded_dat$CATEGORY
)

leaflet(merged_geocoded_dat) %>%
  addProviderTiles(providers$Stamen.Toner) %>%
  addCircles(popup = ~city,
             radius = ~200,
             color = ~pal(CATEGORY),
             fillOpacity = 1,
             stroke = FALSE) %>%
  addLegend("bottomright", pal = pal, values = ~CATEGORY,
            opacity = 1)